Data modernization POC provides improved and immediate access to predictive insights, built with an out-of-the-box solution

Client

USDA FPAC

Need

USDA FPAC’s workforce lacks access to data tools, has limited training to analyze and extract insights from data, and is limited in data science resources.

Solution

Cadmus built a custom data pipeline, which aggregates, processes, and applies ML models to data from multiple disparate FPAC and geological data sources, in a few weeks using out-of-the-box vSTART components.

Impact

Key data sources used in the FPAC POC

Key aspects of the technical architecture for the FPAC POC

The challenge

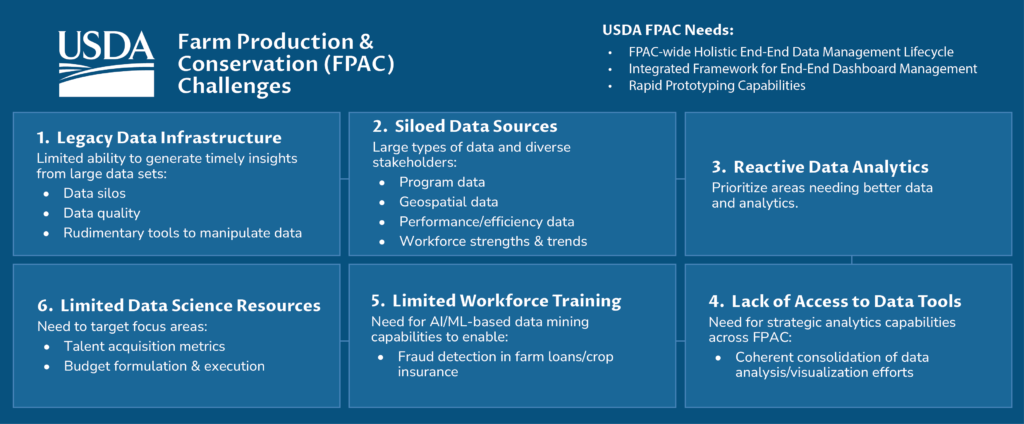
Many federal agencies struggle with a cumbersome legacy data infrastructure, excessively dispersed data, limited scientific tooling, and a reactive culture toward data analytics. In addition to these challenges, USDA FPAC’s workforce is limited in data science resources, lacks access to data tools, and has little training to analyze and extract insights from data.

USDA: Farm Production & Conservation (FPAC) Challenges. USDA FPAC Needs: FPAC-wide Holistic End-End Data Management Lifecycle, Integrated Framework for End-End Dashboard Management, and Rapid Prototyping Capabilities. 1. Legacy Data Infrastructure: Limited ability to generate timely insights from large data sets: Data silos, Data quality, and Rudimentary tools to manipulate data. 2. Siloed Data Sources: Large types of data and diverse stakeholders: Program data, Geospatial data, Performance/efficiency data, and Workforce strengths & trends. 3. Reactive Data Analytics: Prioritize areas needing better data and analytics. 4. Lack of Access to Data Tools: Need for strategic analytics capabilities across FPAC: Coherent consolidation of data analysis/visualization efforts. 5. Limited Workforce Training: Need for AI/ML-based data mining capabilities to enable: Fraud detection in farm loans/crop insurance. 6. Limited Data Science Resources: Need to target focus areas: Talent acquisition metrics, Budget formulation & execution.
Exhibit 1: Multi-faceted nature of the data management & analytics challenges for USDA FPAC

To address these challenges, the agency is on a mission to transform and modernize its end-to-end data management platform, culture, processes, and tools. FPAC possesses large amounts of valuable real-time and historical data and has embarked on a journey to harness and maximize the power of this data in the service of a diverse set of stakeholders.

The solution

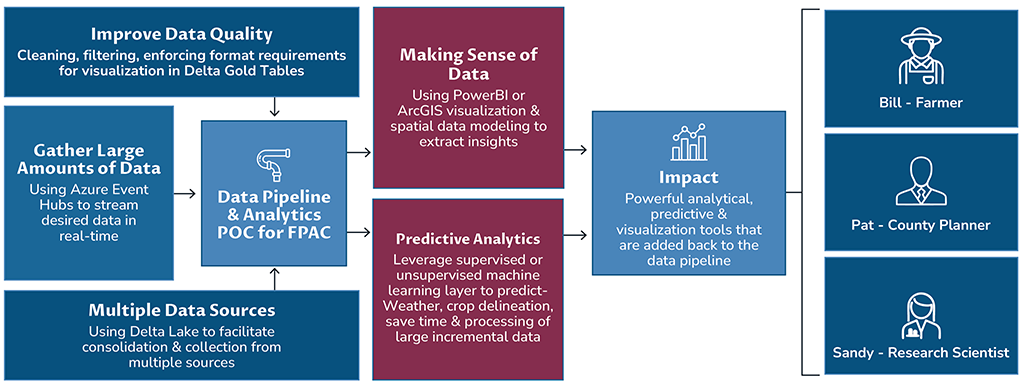
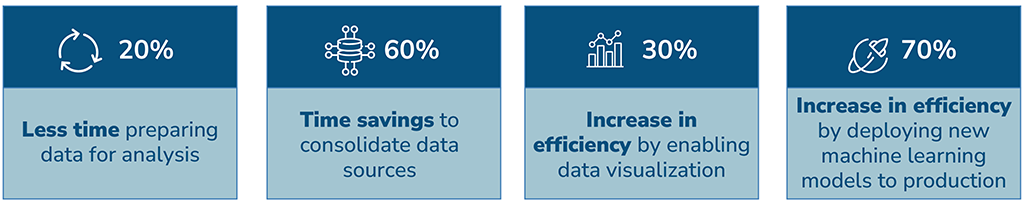
As a proof of concept (POC) for FPAC, Cadmus leveraged vSTART, an internal platform of out-of-the-box components, to build a custom data pipeline in a tight timeline. This POC consolidates disparate data sources, consumes batch and streaming data, uses Delta Lake layers to improve quality and aggregation challenges, and streamlines the ability to create dashboards and visualizations of varying complexity for multiple use cases. By leveraging vSTART, Cadmus was able to quickly and efficiently build a robust data pipeline that can handle large volumes of data and provide valuable insights for various business needs.

“The POC approach followed a consistent Cadmus strategy of applying Agile and UCD principles throughout the product lifecycle. This approach ensured that we focused on the customer experience while satisfying business objectives. By leveraging reusable components from vSTART, we designed and built the minimum viable product (MVP) within weeks,” said Khanh Armstrong, Cadmus Director of Corporate IP.

#1 Data Sources - Batch & Streaming Data: Structured/Unstructured data, Geospatial data, Static/Dynamic data. #2 Streaming Data Ingestion: 10 years of telemetry data from 1000+ weather stations, Python scripting, Azure Event Hub, and Azure Data Lake. #3 Data Processing Quality: Azure Databricks, Delta Lake and Bronze, silver, gold characterization of data quality. #4 Analysis & Insights: Structured/Unstructured data, Geospatial data, and Static/Dynamic data.
Exhibit 2: Pipeline data flow through the POC
20% Less time preparing data for analysis. 60% Time savings to consolidate data sources. 30% Increase in efficiency by enabling data visualization. 70% Increase in efficiency by deploying new machine learning models to production
Exhibit 3: Efficiencies achieved by using Cadmus’ data & analytics POC

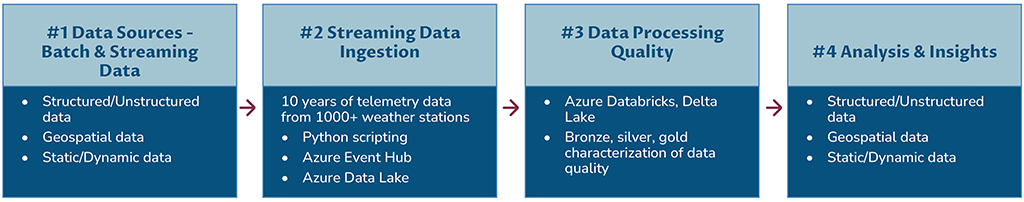
Cadmus’ overarching technical strategy and the architecture for this POC reflect our understanding of FPAC’s vision of a data-driven digital transformation mission. The POC itself provides easy and immediate access to a powerful combination and overlays of weather, crop, soil, NAIP imagery data from 2015 through 2019 available at their fingertips via data visualization tools with data exporting and sharing capabilities. 

We consider this POC to be a minimum viable product for a much larger data pipeline solution that can be incrementally built to cater to FPAC’s custom needs. The technical architecture for this POC provides foundational technical components while retaining the flexibility to develop additional functionality.

Cadmus’ architecture leverages a best-in-class technology stack, bringing all data to one platform with the ability to perform data governance and lay the foundation for developing advanced, powerful analytical and visualizations tools on top of assured quality of underlying data,” said Sarma Musty, Cadmus Data Architect.

Process Overview: 1. Gather Large Amounts of Data: o Source: Using Azure Event Hubs to stream desired data in real-time. 2. Improve Data Quality: o Methods: Cleaning, filtering, and enforcing format requirements for visualization in Delta Gold Tables. 3. Data Pipeline & Analytics: o Tools: Using Delta Lake to facilitate consolidation and collection from multiple sources. o Purpose: Proof of Concept (POC) for FPAC. 4. Making Sense of Data: o Techniques: Using PowerBI or ArcGIS for visualization and spatial data modeling to extract insights. 5. Predictive Analytics: o Approach: Leveraging supervised or unsupervised machine learning to predict weather, crop delineation, and save time and processing of large incremental data. 6. Impact: o Users: Bill (Farmer), Pat (County Planner), Sandy (Research Scientist). o Benefits: Powerful analytical, predictive, and visualization tools that are added back to the data pipeline.
Exhibit 4: Summary of Cadmus’ data & analytics POC